How does it work?
-
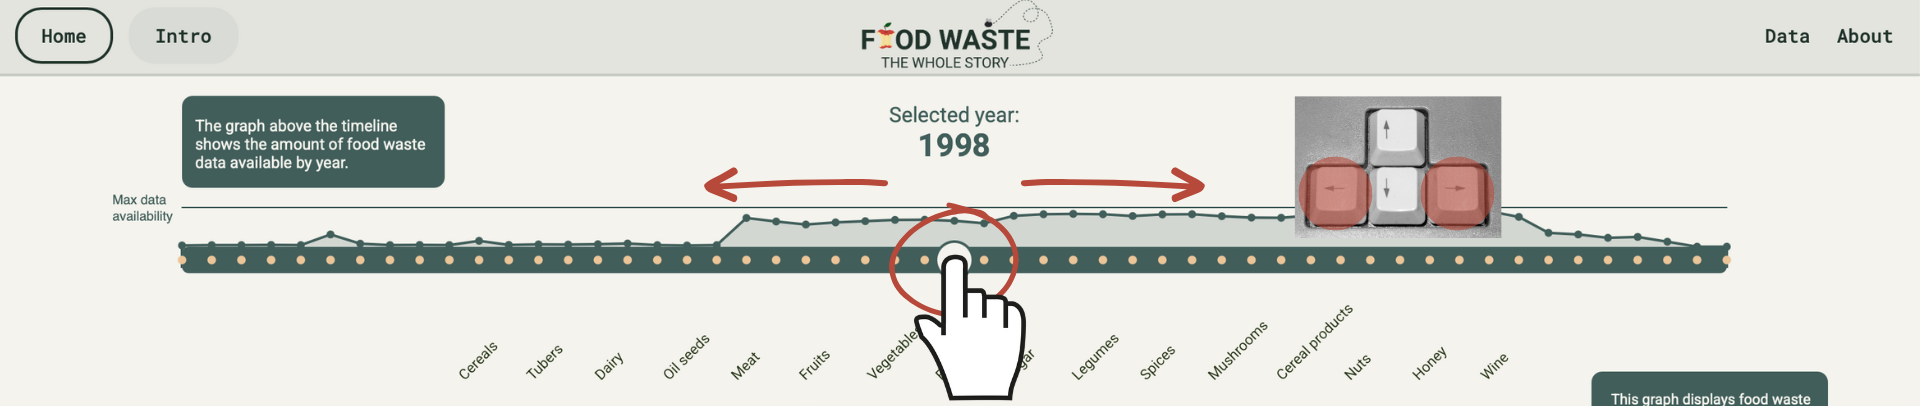
Navigate Time
Use the Timeline at the top to change years. (drag left/right, click, or use the keyboard arrow keys.)
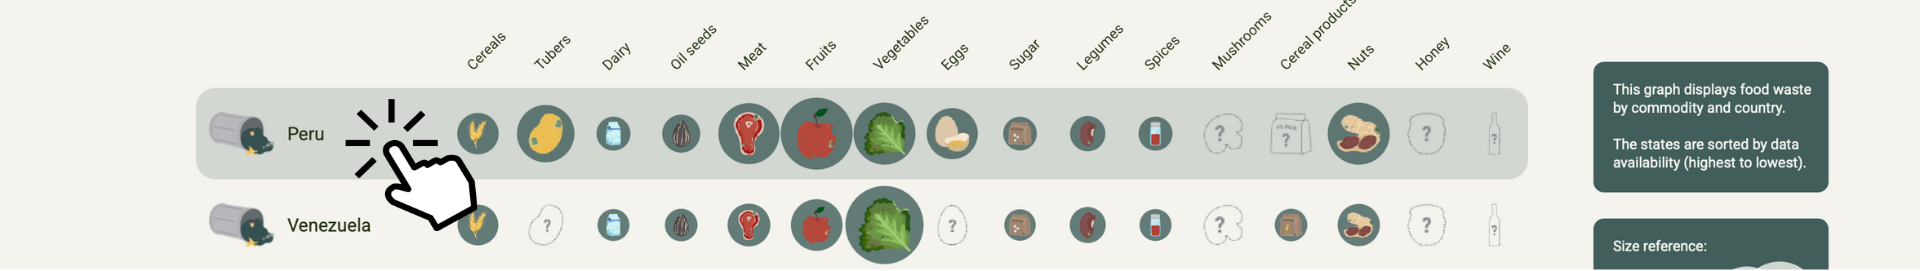
Look at the Matrix to see the connection between Country and Product. (Note: percentages are not comparable.)
-
Dig Deeper
Want more details?
Click on any row (Country) to open a dedicated analysis page.
-
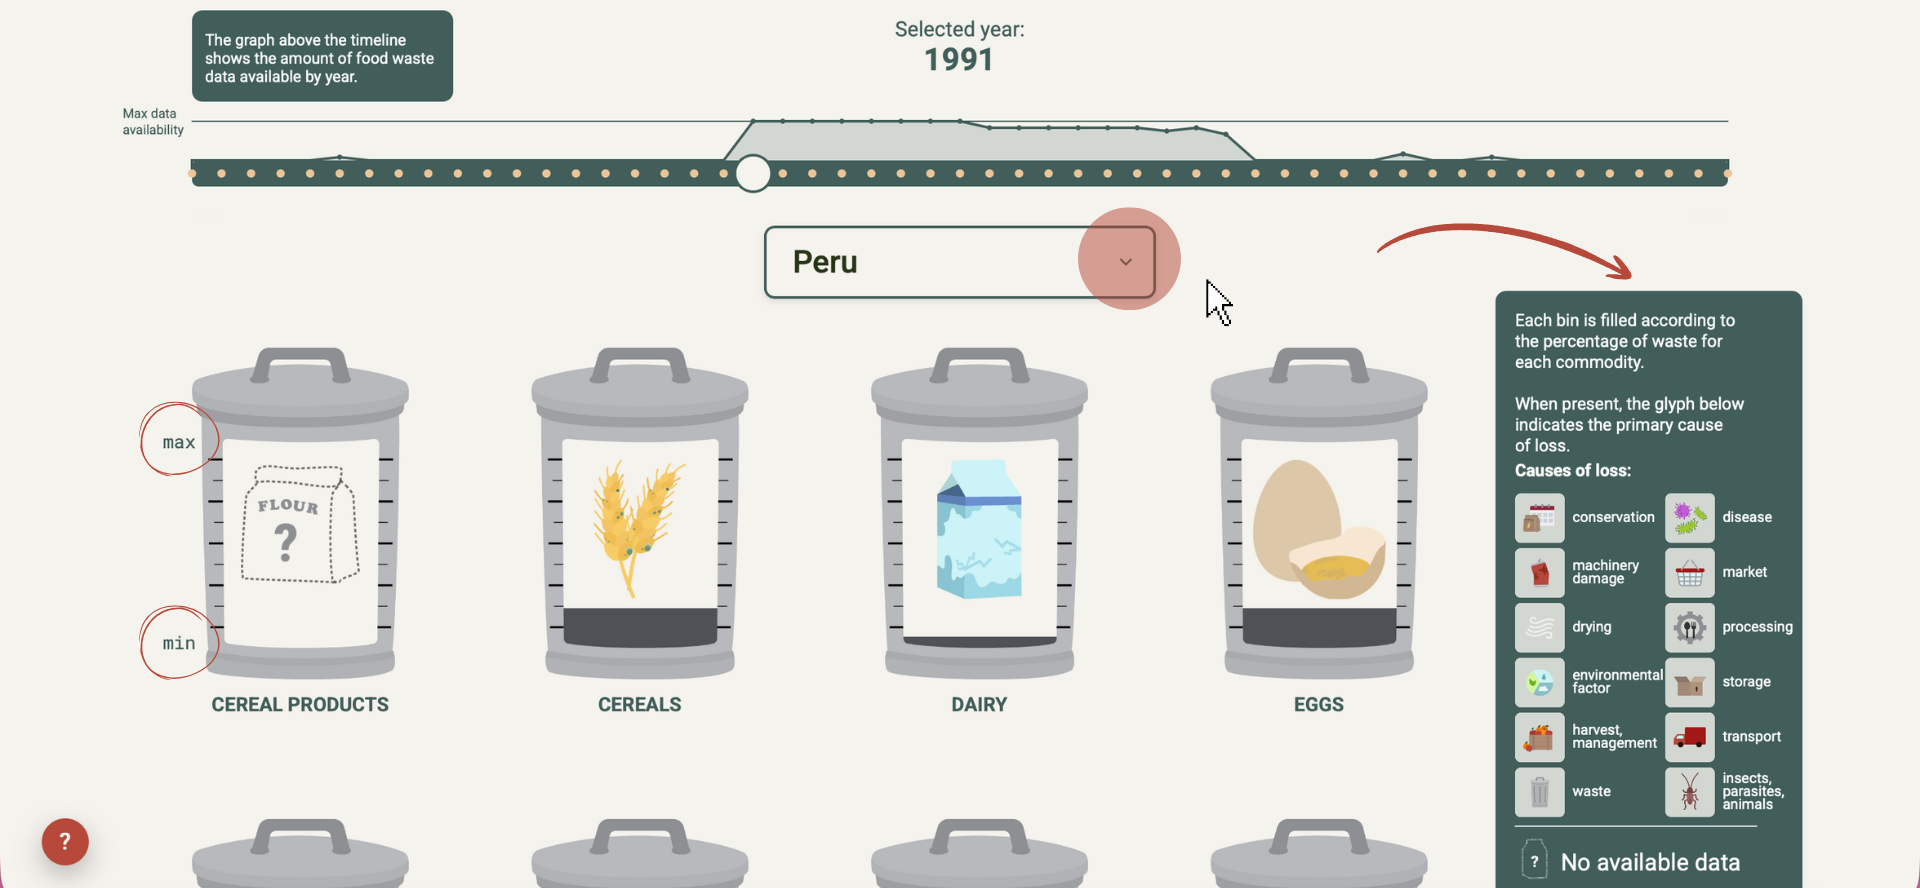
Analyze the Causes
Inside the country view, discover the main causes and supply chain stages where food is lost (e.g., during harvest or transport).
-
Explore details
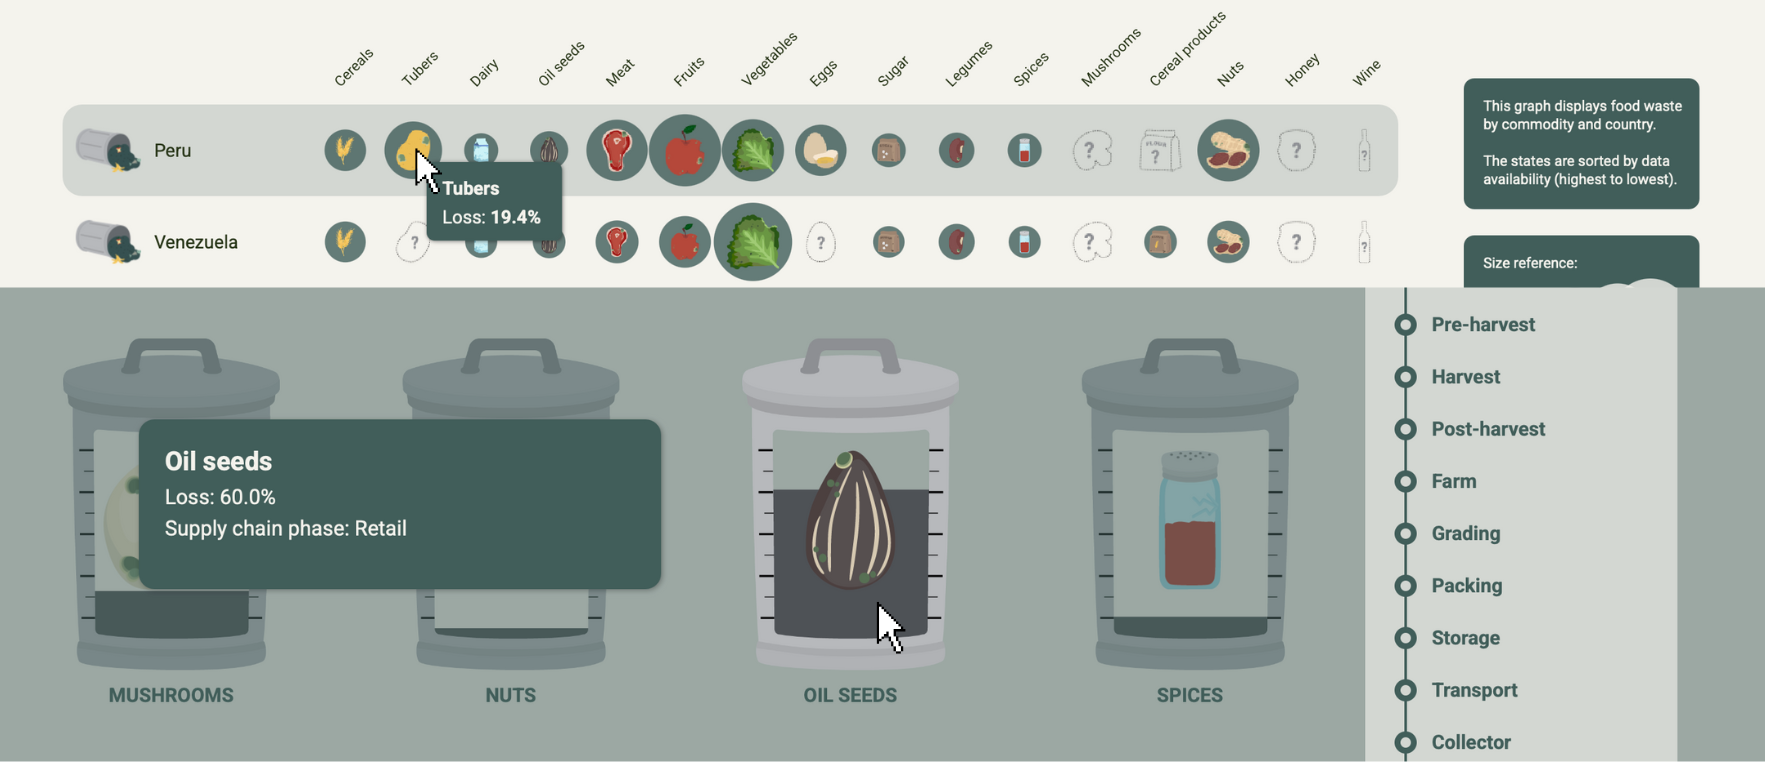
Don't just look, interact! Hover your mouse over charts and bars to reveal precise numbers and "hidden" info.
-
Ready to explore?
Dive into the data and discover the whole story.